Posts

Showing posts from January, 2018

Water Systems Hands-On Task - Creating Water Filters

Image
Design Task - Creating a Water Filter to Remove Impurities from a Non-Potable Freshwater Sample             In groups, you will research about, design, and then build, two simple water filtration devices, using only materials that can be found in the wilderness. One filter will have three filtration layers and the other one, five layers. You will filter a total of two 500mL samples per device. Your goal is to create the cleanest possible water sample. Successfully filtered water will be judged by having a reasonable odour (smell), have minimal discolouration (“brownish or yellowish-ness”) and look nearly transparent (see-though, with as few floating clumps or particles as possible). Research Before Starting: Articles: https://www.wikihow.com/Make-a-Water-Filter http://all-about-water-filters.com/top-easiest-diy-water-filters-you-can-make-at-home/ http://pbskids.org/zoom/activiti...

Municipal Water Filtration

Image
https://www.youtube.com/watch?v=20VvpASC2sU https://www.youtube.com/watch?v=k9NLmD-cPgc https://www1.toronto.ca/city_of_toronto/toronto_water/files/pdf/water_treatment_process.pdf http://filterbutler.com/blog/facts-about-water-treatment-in-toronto/ 1. What are the main purposes for water filtration? 2. Explain how is water diverted from Shoal Lake to the treatment plant in Winnipeg. 3. How many litres of water are transferred from the Lake on a daily basis? 4. Where is water kept before going into the filtration plant for processing? 5. How many litres of water are stored in the four reservoirs outside the plant? 6. NOT IN THE VIDEO: Find the population of Winnipeg, Manitoba. 7. How long will the 8.8 billion litres last before Winnipeg uses it up? 8. Jot down two facts about the filtration plant you find impressive (i.e. cost, equipment inside). 9. How much water can be treated on a daily basis? 10. Explain the purpose of Sulphuric Acid in the filtration process. 11...

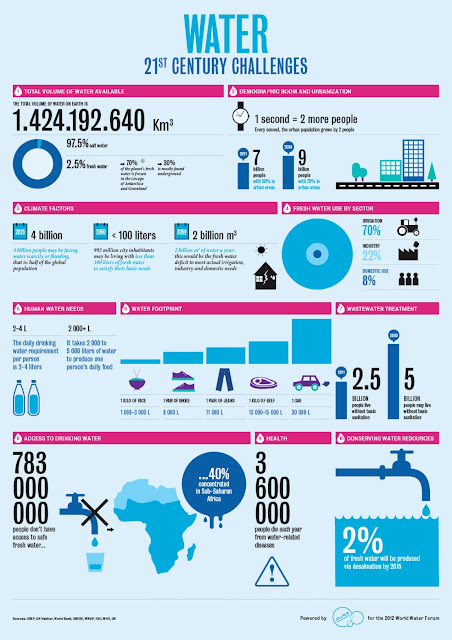
Water Infographic

Image
*Due four periods from the assignment start date Each Infographic should include information and related images about: 1) Global distribution of freshwater. What percentage is freshwater? Where is it found? (3.1) 2) Global distribution of salt water. What percentage is salt water? Where is it found? (3.1) 3) Predictions about how long our fresh water supply will last at current rate of population growth and consumption. (1.2) 4) Human impacts on glaciers and polar ice caps. What are our negative impacts? How long will they last? (3.4) 5) Human impacts on saltwater (pollution) and saltwater ecosystem. What are our negative impacts? How much damage has been done? (1.2) 6) Human impacts on fresh water and freshwater ecosystems. What are our negative impacts? How much damage has been done? (1.2) 7) Comparison of average personal water usage in developed versus developing nations. (1.1) 8) Strategies to reduce personal water consumption. (1.1) 9) At least one tech...